Our final assignment for my statistics for public managers class (#JSGS807) was to use an online data set to explore a policy issue of your choice and to create data visualizations.
My policy issue was to look at data surrounding opioid related deaths in Canada and to look at how Saskatchewan compares to other provinces and Canada as a whole. Opioid related deaths have become a lot like cancer in that it seems like there are few families not affected by addiction to opioids and I’d hazard a guess that most people know someone that has passed on due to an overdose. Just in this past year, my best friend’s cousin whom I knew casually, lost her battle with addiction. Opioids ruled her life as well as her death.
Leaving the anecdotal behind, I looked to the Government of Canada’s report on “Apparent opioid-related deaths” and the Government of Saskatchewan’s data on
“Drug toxicity deaths between 2010 and 2018”.
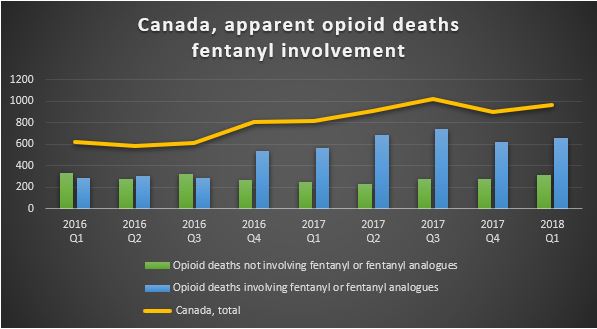
Canada is facing an opioid crisis. In the last year and a half alone, opioid deaths have increased by 60 percent and the largest increase in this trend is due to fentanyl or fentanyl analogues being associated with the opioid used.
Looking at the opioid deaths by province; British Columbia, Ontario and Alberta had the highest number of deaths in 2016 and 2017…
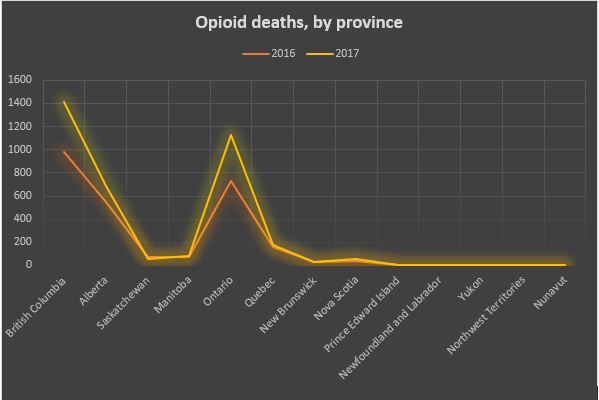
… even though Quebec has the second highest population in Canada.
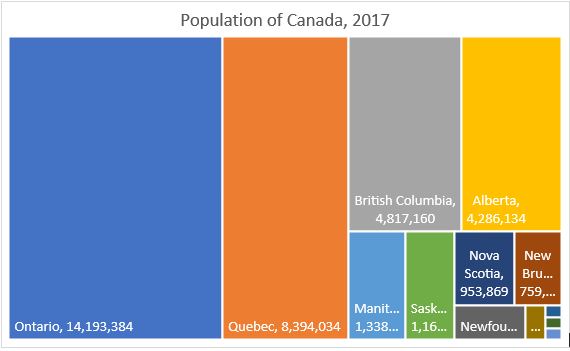
Why Quebec has a much lower number and rate of death due to opioids is interesting, but not part of my original question. Are Quebec’s drug laws and policies such that even if addiction rates are similar, fewer people are dying? If so, this may well point to strategies that could be considered to be adopted to reduce rates elsewhere, but I still haven’t looked at my target, Saskatchewan.
How does Saskatchewan compare to Canada overall and relative to its population size? Looking at population size, Saskatchewan is about on par with the other provinces with similar-sized populations. But if you look at the breakdown of male and female opioid deaths for 2017, Saskatchewan is an outlier.
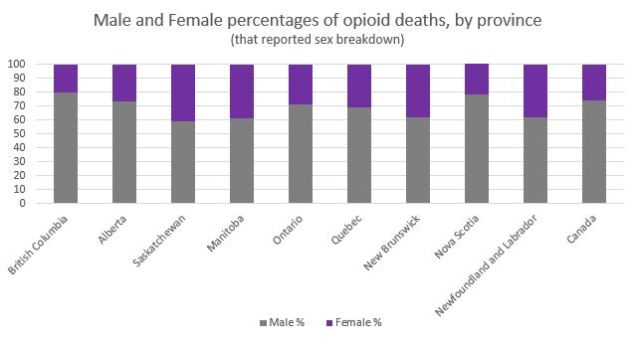
Overall in Canada, females represent 26 per cent of opioid related deaths as seen by the purple sections above but in Saskatchewan in 2017, the percentage of female deaths related to opioids is 41 per cent, the highest in the country. Saskatchewan has had the highest percentage of female opioid related deaths in Canada for the past 5 years. Is it perhaps related to the manner of death?
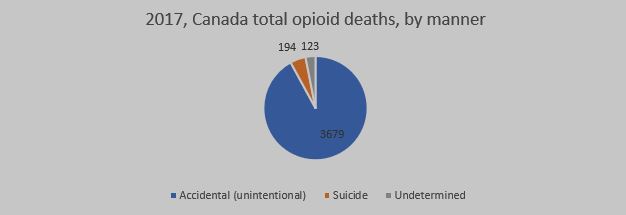
In 2017, the vast majority of opioid related deaths were ruled to be accidental overdoses. Looking at the National average, only 4.9 per cent of the deaths were ruled to be suicides. The data in that report held no further breakdown, so I looked to Saskatchewan’s data to see if I could see what was different about Saskatchewan. While I did note that women were much more likely to commit suicide by intentional overdose in Saskatchewan, I did not have the data from other jurisdictions to compare this to so in the end I am left with questions and other paths to explore.
To continue looking at this, my next steps would be to see if I could find data sets that may help me understand why the female/male ratio for Saskatchewan is the highest in Canada and I would explore why Quebec’s death rates are so low. If it isn’t an artificial difference in data (like differences in reporting) and is truly a much lower rate per 100,000 people in the province, there may be policies to adopt that would reduce the harm in Saskatchewan and in other jurisdictions.
Hey, not every wheel has to be invented from scratch, if you find a good policy, adopt it and apply it!
Looking at the process I used to examine the issue; well, it reminds me that I have a few basic beliefs that I use to guide my life.
Treat others as you’d like to be treated.
Don’t do anything you wouldn’t like to have broadcast (especially prudent now that life can be live streamed).
Assume you can do anything until experience teaches you that you should focus your energies elsewhere.
Producing analytics may well be one of those things that fall on the weaknesses side of the ledger for me. Knowing what your strengths and weaknesses are is half the battle and producing mind-blowing visualizations may not be one of my strengths. I spent more than 30 hours trying to download data sets, trying to format them into something I could use in Tableau, getting them into Tableau and then trying to produce something from them. There is a lot of data out there, but little of it is ready to use as is.
What I learned from all of this (the assignment and the class) is that I will remember to have a deep appreciation for my data analytics team at work. It isn’t easy!
I also learned from the class that even if I am not (currently) highly proficient at producing visualizations, I can be a better and more knowledgeable consumer of statistics, infographics and other visualizations.
But I haven’t given up on learning this skill. I am persistent if nothing else.


