For the first assignment in my Statistics for Public Managers class, we needed to use an online data set to calculate and graph descriptive statistics.
There is a lot of data out there but it isn’t all easily accessible and much of it doesn’t lend itself to statistical analysis very well. I downloaded and perused a few types of data before settling on a file of data from the Government of Alberta.
The data set I finally examined was Alberta’s Blue Book data from the first quarter of the
2018-2019 fiscal year. It shows who is doing business with government and payments that have been made for supplies or services purchased by departments from the General Revenue Fund.
As I didn’t have a question up front, in my examination of the data, I analysed it I three different ways: by single transaction, by total payments per supplier, and by government department.
Payments ranged from a minimum amount which was a refund to the government of $171,000 to a maximum single payment of $181,163,819 making the range $181,334,819. With 5073 payments ranging so broadly, and a single payment representing 12.6% of the spending recorded in the blue book for the quarter, I was not expecting a symmetrical distribution of size of payments.
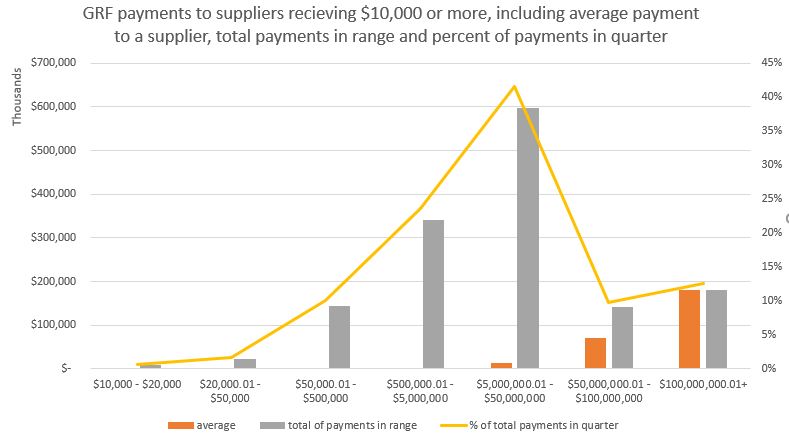
Even when the 5073 payments were totaled per unique supplier, the data included 2590 suppliers. With the mode at the extreme lowest point of total payments to a single supplier and the median total payment per supplier in the quarter at less than 1/10th of the average total payment per supplier, it indicated an expected positive skew in the data. Calculating the skew confirmed a large positive skew at 27.8.
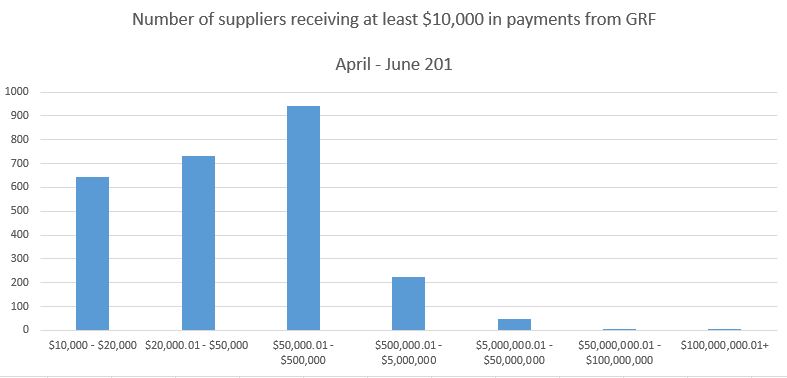
Grouping the payments by governmental department, 89.4% of all suppliers receiving at least $10,000 in the quarter received less than $500,000 and when combined, represented 36% of the total amount recorded for the quarter. The other 10.6% of suppliers received 64% of the total in the quarter.
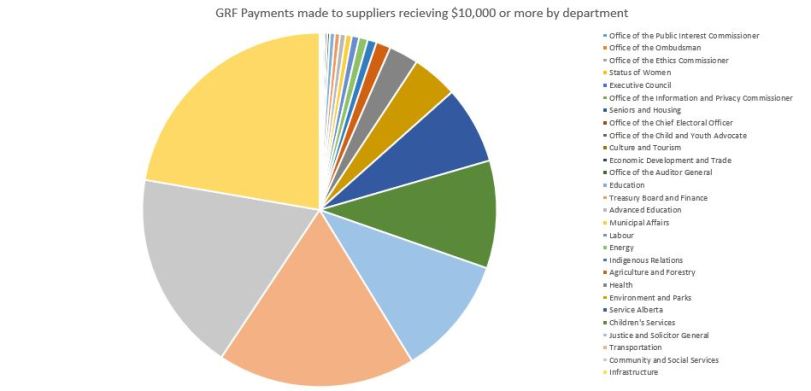
Comparing government departments to each other, the department spending the most was Infrastructure, and the three departments of Infrastructure, Community and Social Services, and Transportation made 58% of all payments.
In the end, I learned a lot about payments by departments in the Alberta Government in the first quarter of the 2018-2019 fiscal year and what you can and can’t do with descriptive statistics.


